Website performance is an important aspect of maintaining high ranking in the SERPs. Regularly checking on your site’s performance, especially your page speed insights, is a must for any SEO. A great user experience is becoming more and more important to search engines particularly Google as it prepares for its Page Experience Update coming May 2021.
DOWNLOAD THE FREE CORE WEB VITALS WEBINAR
Understanding Core Web Vitals related to page speed tests
Users expect to begin interacting with a website within seconds. They will very quickly click off of a site if content isn’t loading and they’re unable to interact with your site almost immediately.
While there are a number of metrics Google measures to consider page speed, there are three Core Web Vitals that score how quickly your page content loads. Understanding these metrics and how to correct your web vitals will be beneficial to your page speed and SEO as Google prepares to severely impact sites with their May update. Below are the three metrics necessary for you to familiarize yourself with:
- LCP – Largest Contentful Paint refers to the point when main content is loaded on a page
- CLS – Cumulative Layout Shift is layout instability and refers to when content shifts up or down and you unexpectedly interact with part of a site you didn’t mean to
- FID – First Input Delay refers to the delay when your page is loading but you can’t immediately interact with it
You can learn more about evaluating and fixing Core Web Vitals in this post.
Resources to test website speed for your business
There are a number of resources to dive deep into the health and performance of your website. You can use them to test the performance of your site as well as competitors. Understanding how your page speed compares to your competitors should be part of your competitive analysis. Sometimes, you might find that fixing the errors provided to you by one resource may not have improved scores the way they were predicted to. Because of this, it’s important to have several tools you can combine to gain different suggestions or recommendations into fixes. You can perform a page speed test using any of the below resources.
BrightEdge Instant. You can leverage BrightEdge Instant to assess page speed performance and gain insights into Core Web Vital metrics. Instant provides actionable and prescriptive recommendations to improving page speed across the most important pages of your site. You can run ten URLs to test website speed with Instant, speeding up the task compared to inputing one URL at a time using Lighthouse.
From your analysis, you can export all of the granular information pointing to specific files that may be causing page speed issues. Below you can see what testing website speed in Instant looks like.

BrightEdge ContentIQ. Performing a website audit using ContentIQ will also give you an audit into page speed insights and how quickly your pages are loading. ContentIQ offers a response time which is tied to a metric called TTFB – or time to first byte. TTFB measures how long a browser has to wait to receive its first byte – or piece of data – from your site.
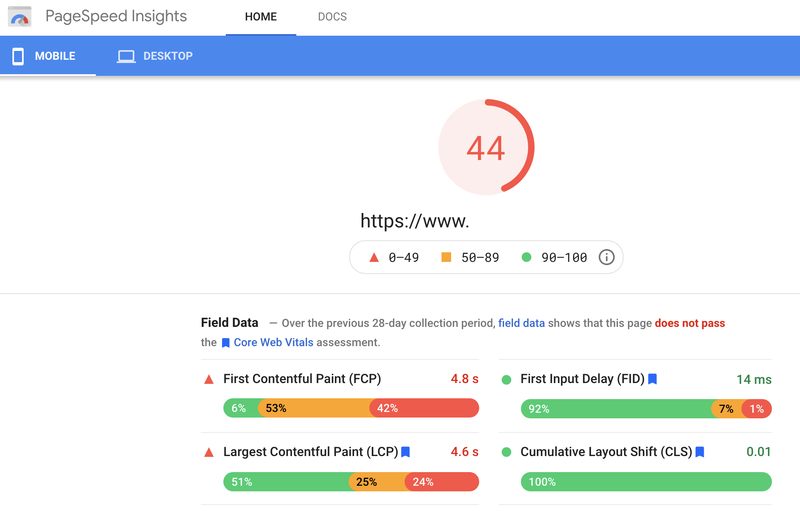
Google PageSpeed Insights. PageSpeed Insights is also referred to as Lighthouse. It analyzes and calculates your page to give you an overall performance score on both mobile and desktop. If you test your page multiple times, you might notice that the scores fluctuate. The reasons for this are many and can include testing on different devices, browser extensions, traffic routing and more. Google recommends you think of your site performance as an overall score that includes more than one score rather than a single number.
The weight of each performance metric Lighthouse 6 considers includes:
- First Contentful Paint – 15%
- Speed Index – 15%
- Largest Contentful Paint – 25%
- Time to Interactive – 15%
- Total Blocking Time 25%
- Cumulative Layout Shift – 5%
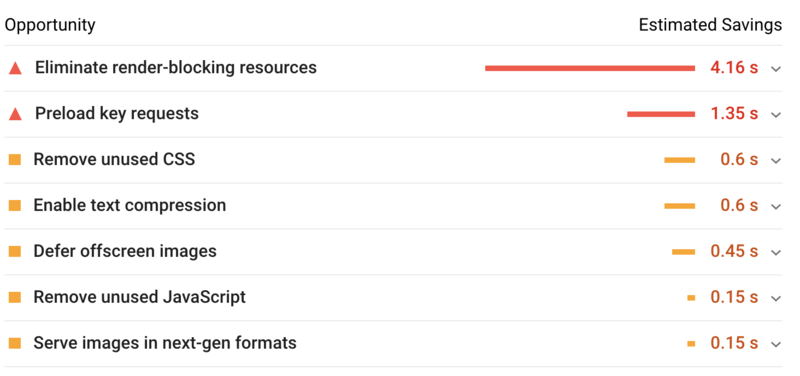
Below you can see the information Lighthouse provides you about your page speed insights.


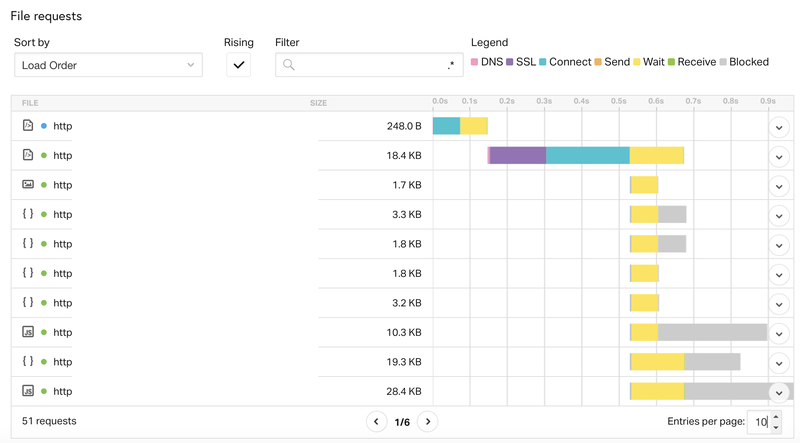
Pingdom Speed Test. The most basic use of Pingdom is free and offers a different visualization into page speed insights and recommendations on improve page speed performance. With Pingdom, you can sort by what’s most important to you. You can determine strategies to fix errors by sorting by load order, load time, receive time, send time and more. Understanding which areas are costing your site a slow loading time and sorting them by most impactful can lead to efficiency when fixing. Below you can see an example of the information Pingdom offers when testing website speed.

Improving page speed performance
Once you test performance, it’s time to fix any errors that bog down your load times. If you have the time, strategize around which fixes are most impactful to the health of your website.
Take a look at your scores and locate the elements of your site that take the longest to load and fix those first. For example, if Lighthouse is indicating it takes 4.16 seconds for render blocking resources to load, you can save up to 4.16 seconds of load time by eliminating render blocking resources.
Check out this post on fixing page speed after you test performance for more information on these insights.
Faster pages make users happy and provide an overall better user experience. If your pages take too long to load, you could be losing customers within seconds. The first step in maintaining good organic ranks and quality traffic to your site is by performing page speed tests to understand where you can improve page speed.


