
Refining AI Overviews for Maximum Impact

What a big month for AI Overview evolution July has been! We’ve witnessed some significant enhancements that appear to show Google is paying attention to what’s working with competitors. By incorporating successful elements from AI-first search engines like Perplexity, AI Overviews are becoming more specialized and user-focused. This month has seen AI Overviews dial into the areas where they are most useful, enhancing decision-making processes with strategic frameworks and providing more tailored information.
One of the key areas BrightEdge Generative Parser™ measured is "When" statements in AI Overviews. These statements provide users with clear frameworks for considering various topics, particularly in decision-making processes.
Additionally, AI Overviews are increasingly focusing on long-tail, specific queries rather than broad, general searches.
Furthermore, the integration of facets in AI Overviews represents a significant advancement. This feature, which allows users to filter and refine search results based on specific attributes, mirrors the functionality found in advanced e-commerce platforms.
There was a whole lot more BrightEdge Generative Parser™ was able to identify in July! In fact, here are ten key developments which highlight how AI Overviews are evolving:
- AI Overviews are getting more dynamic and tailored to specific nuances of queries
BrightEdge Generative Parser™ is now tracking how AIO guides user thinking. One of the most prevalent is with “When... you may consider...” statements. These statements provide users with specific frameworks for considering various topics, especially in decision-making processes and currently show up mostly for 25% of the eCommerce search queries. This is very similar to the experience Perplexity uses to help users shop.
(Perplexity query using “when purchasing” for the query “All weather outdoor TV”)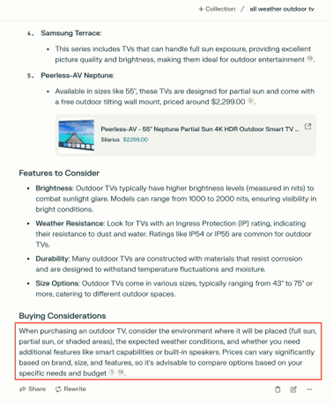
The AI Overviews in July reveals several key patterns in the use of "When" statements:
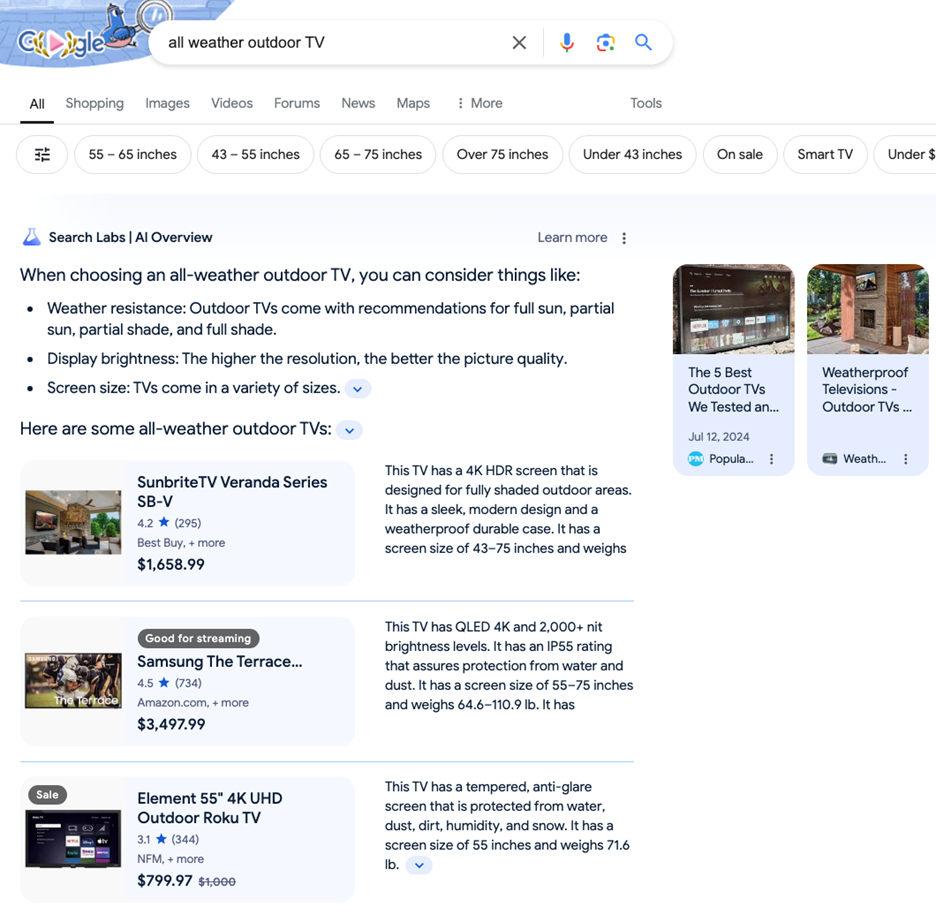
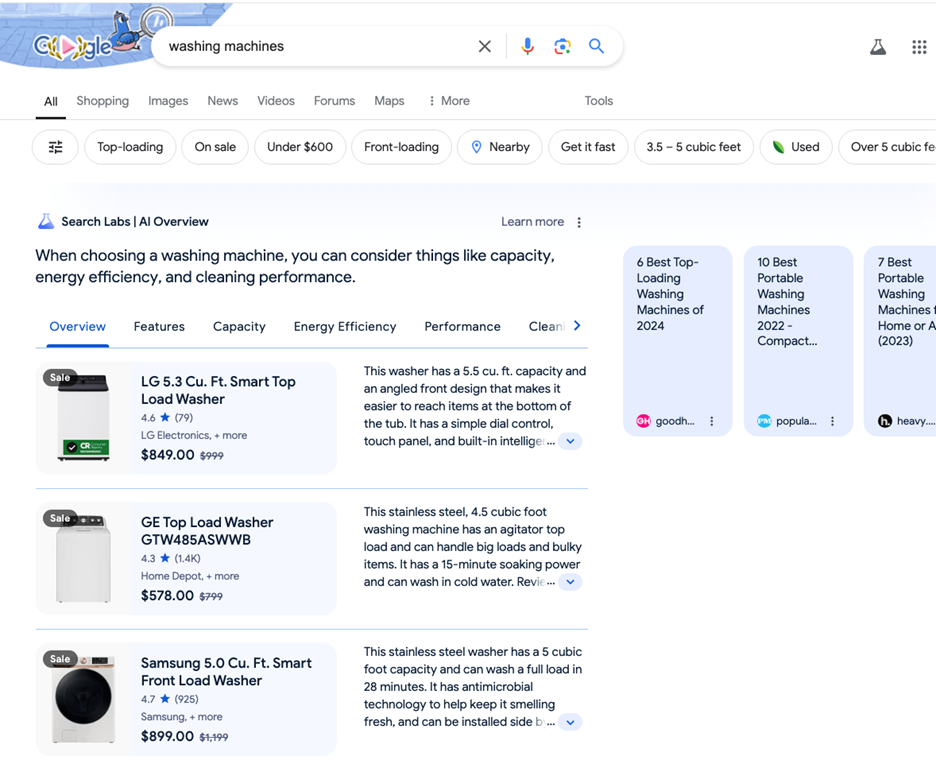
- Product Selection Guidance: The most common pattern, appearing in 64% of the added AI Overviews, is the phrase "When choosing a [product], you can consider things like..." Example: "When choosing an all weather outdoor TV, you can consider things like picture weather resistance, display brightness and screen size."
Example: "When choosing an all weather outdoor TV, you can consider things like picture weather resistance, display brightness and screen size."
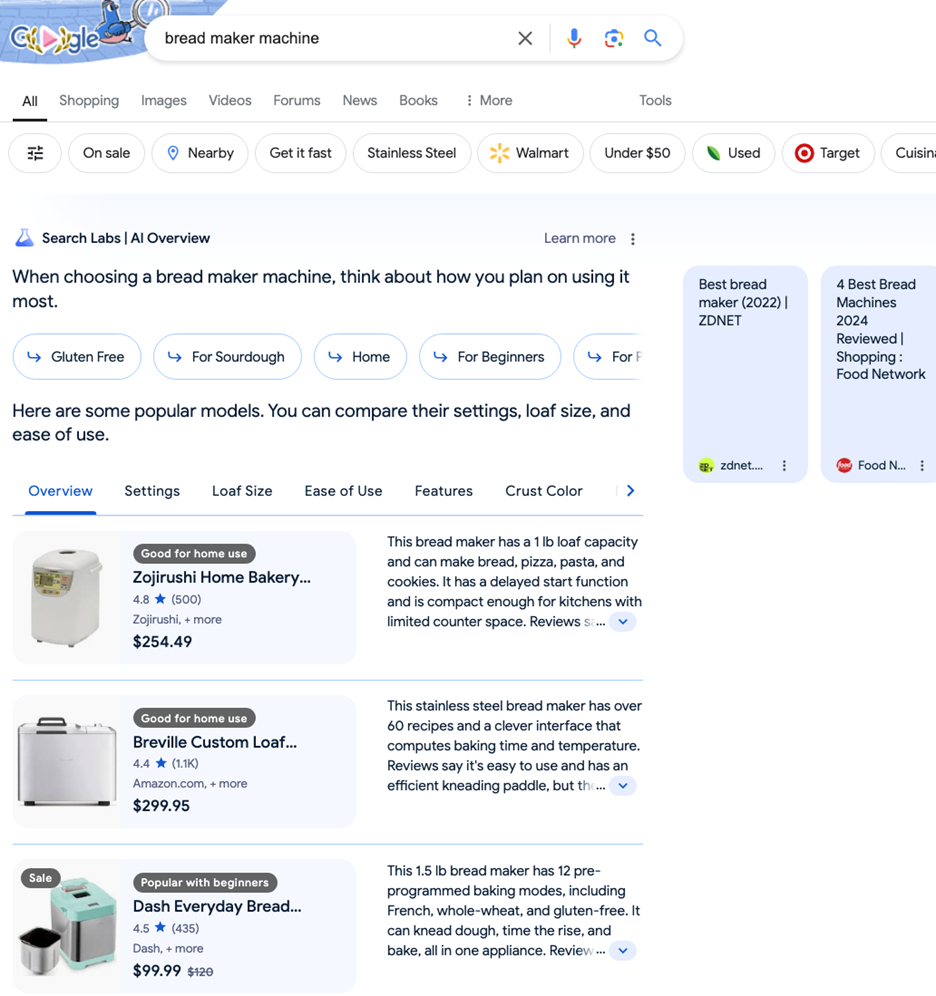
- Usage-Based Considerations: About 18% of the AI Overviews with “When” will use the phrase "When choosing a [product], think about how you plan on using it most." This pattern is often seen in electronics and appliance categories.
Example: "When choosing a bread maker machine, think about how you plan on using it most."
These "When" statements are not limited to high-volume searches. We see them applied across a wide range of search volumes, from as low as 320 monthly searches for "chandelier ceiling fan" to as high as 368,000 for "washing machines”. This suggests that AI is being used to enhance user experience regardless of the popularity of the query.
The expanded content following these "When" statements typically includes: -
- No related list or suggested query 55% of the time. These are the cases where the “when” statement contains all the information about the choices, for example “When choosing an armchair, you may want to consider its comfort, material, and size.”
- Facets (present in 21% of cases)
- Unordered lists of features or factors to consider (present in 16% of cases)
- Product viewers with detailed specifications (present in 8% of cases)
This structure allows AI Overviews to provide more actionable information to users, guiding them through complex decision-making processes. For instance, the AI Overview for "adjustable mattress" not only suggests considering "material, size, and slats" but also provides a detailed product viewer comparing different options.
By providing structured, scenario-based advice, these AI Overviews are becoming more adept at anticipating and addressing user needs across various industries and search volumes. If this trend continues, we can expect to see even more refined and targeted guidance in future AI-generated content.
A feature that’s common with ‘when statements is facets. As with the “when” statements, this is functionality that is present in other AI-first search engines such as Perplexity. In July, BrightEdge Generative Parser™ has identified patterns that are likely to trigger them. This feature, which allows users to filter and refine their search results based on specific attributes, is becoming more common for certain types of products and keywords. It’s also a way to initiate a new search:
Primarily, we're seeing facets appear for products that are: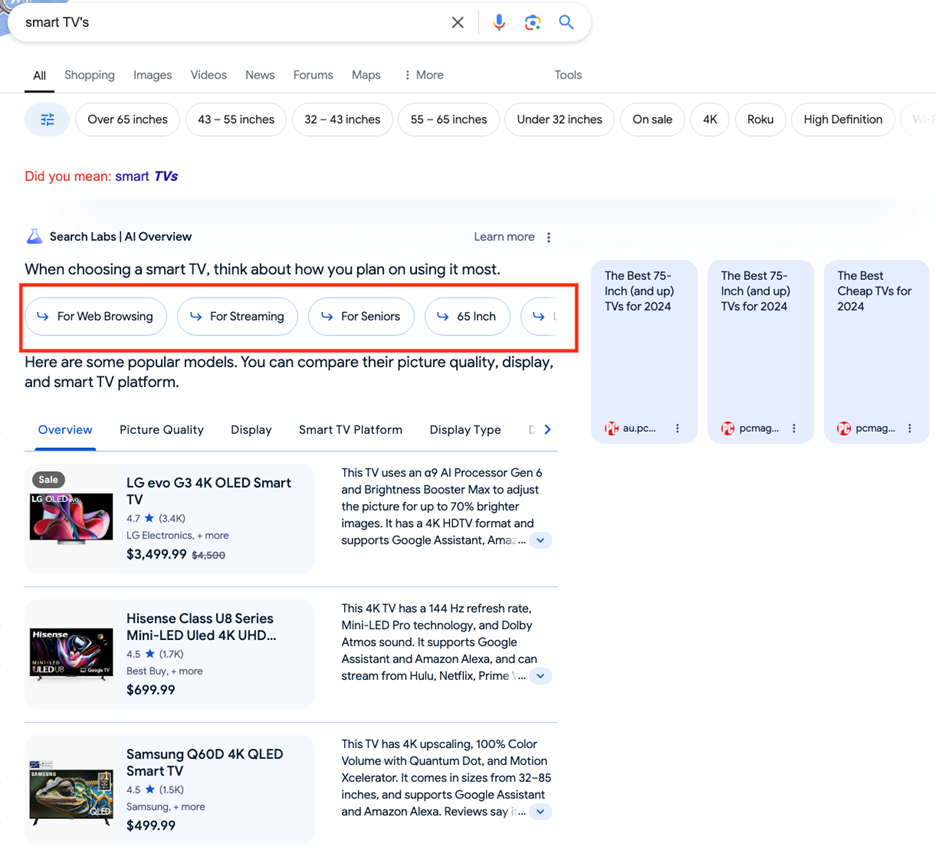
- Technologically Complex: Electronics, smart home devices, and advanced appliances frequently trigger faceted navigation. Think smart TVs, air purifiers, or multi-function kitchen appliances.
- Facets (present in 21% of cases)
- Highly Specific: When a search term includes particular product types, sizes, or technological features (e.g., "32 inch smart TV" or "cordless hand mixer"), facets are more likely to appear.
- Home and Lifestyle Oriented: Many products related to home improvement, kitchen essentials, and personal comfort seem to warrant faceted navigation in AI Overviews.
- Requiring Comparison: Items that consumers typically compare across multiple features, like washing machines or coffee makers, frequently have facets.
This feature shows how AIO adapts to provide more nuanced, user-friendly information for complex purchase decisions. By offering faceted navigation, these overviews are mimicking the filtering options you might find on advanced e-commerce platforms, making it easier for users to narrow down their choices based on specific criteria.
It's worth noting that more general or simple product terms are less likely to generate facets. This indicates a level of sophistication in the AIO’s understanding of when detailed navigation would be most beneficial to the user.
For marketers and e-commerce professionals, this trend underscores the importance of providing detailed, well-structured product information. As AI Overviews generate helpful navigation tools, ensuring your products are accurately and comprehensively described becomes even more crucial for visibility and user engagement in these environments.
- Product Selection Guidance: The most common pattern, appearing in 64% of the added AI Overviews, is the phrase "When choosing a [product], you can consider things like..." Example: "When choosing an all weather outdoor TV, you can consider things like picture weather resistance, display brightness and screen size."
- AI Overviews in July: Shifting Towards Specialized Knowledge and Complex Queries
Throughout July, BrightEdge Generative Parser ™ identified patterns in new keywords triggering AI Overviews. Here are the key trends we noticed:
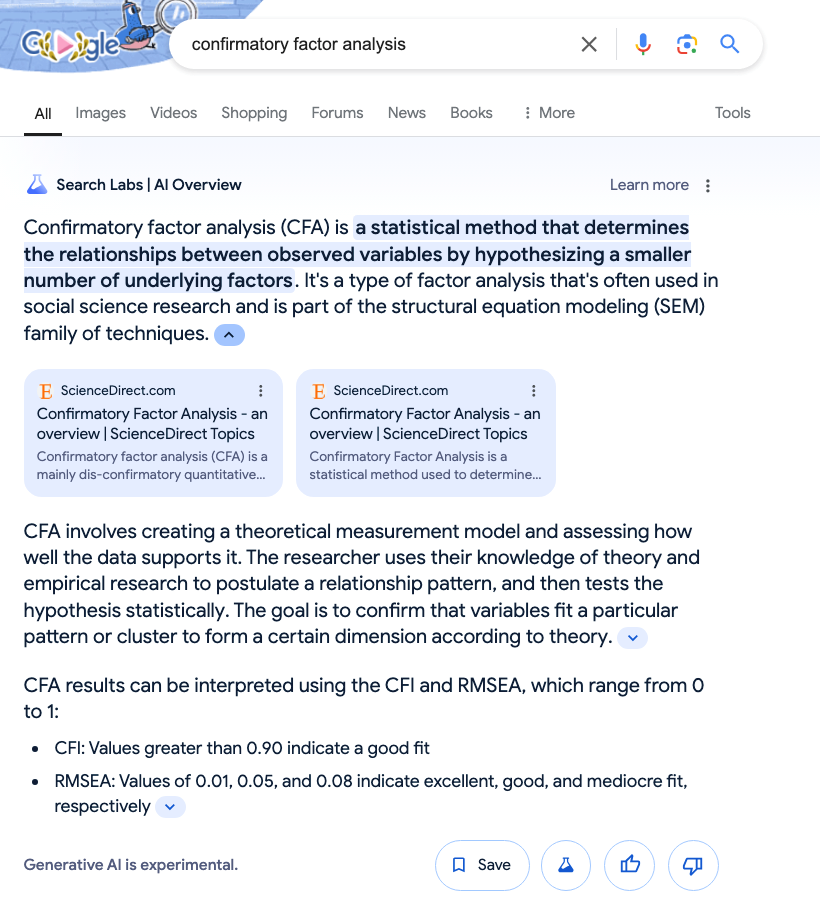
Increases:- Explanations for highly technical terms: There was an increase in AI Overviews for complex, technical keywords (e.g., "confirmatory factor analysis", "tokenization data security"). This suggests a focus on providing in-depth explanations for specialized topics.
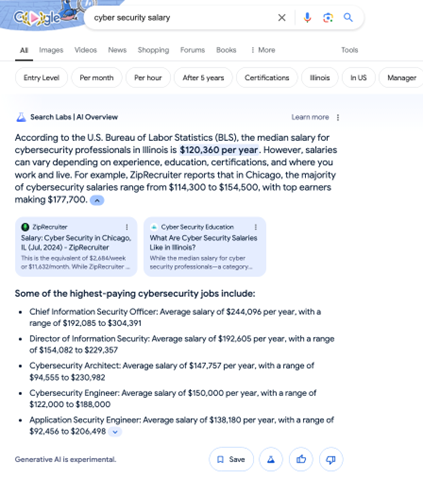
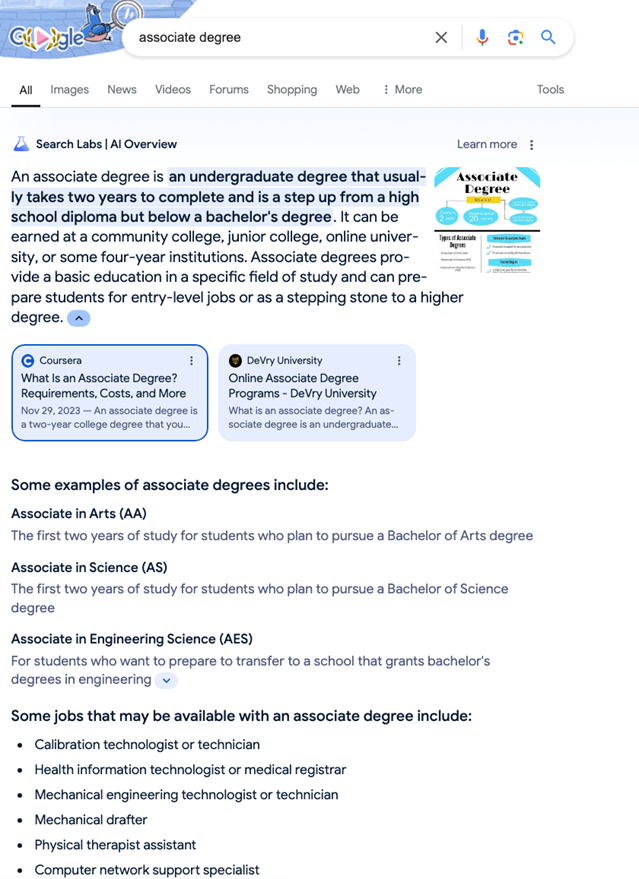
- Salary Information: AIOs jumped from 7% to 85% for queries related to salaries (ex: “nurse salary”, “human resources manager salary”) and from 13% in June to 53% in July for queries related to degrees (ex: “computer science degree”, “online history degree”). We usually don’t see such large changes across entire categories of searches. This then led to a surge in citations for ziprecruiter.com and bestcolleges.com with both domains becoming top 10 cited domains for education in July.
- Long Tail Keywords: AI Overviews appeared more frequently for longer, more specific search terms (e.g., "what is ci cd pipeline", "types of data analysis"). This suggests a focus on addressing nuanced user intents.
- Product Features and Specifications: In e-commerce, AI Overviews increased for queries about specific product features rather than broad categories (e.g., "gooseneck electric kettle" instead of just "kettle").
Decreases:
- Brand-Specific Queries: Similar to June, we saw fewer AI Overviews for brand-specific searches, possibly to avoid potential misinformation.
- Basic How-To Queries: Simple instructional searches saw fewer AI Overviews, likely because traditional search results suffice for these queries.
- Healthcare is still the industry with the most AI Overviews due to a large quantity of high authority sources that can be used reliably by the Large Language Models. However, in July the presence of AIOs decreased from 68% to 61%. This was caused in large part by Google removing AI results for keywords related to rare, genetic, and complex disorders.
- Product Features and Specifications: In e-commerce, AI Overviews increased for queries about specific product features rather than broad categories (e.g., "gooseneck electric kettle" instead of just "kettle").
By focusing on long-tail, specific queries, Google appears to be leveraging AI Overviews to address the nuanced information needs that traditional search results might not fully satisfy. This strategy seems aimed at using AI to enhance the search experience and reduce the amount of searches required to research a topic. It suggests that Google's intention is to position AIO in the growing AI-search space as a tool for deep learning and understanding, rather than for basic information retrieval or simple decision-making processes.
- AIO's grew from 8% to 12% in July, but experienced a decline at month's end
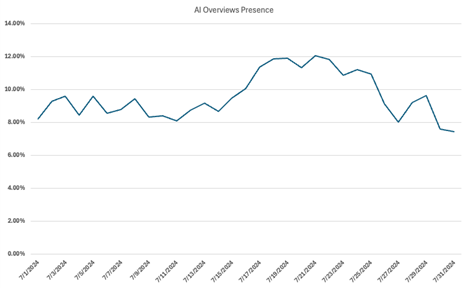
As we moved from June to July, we observed a notable uptick in the presence of AI Overviews, climbing from 8% to above 9% of search results for most of the month. This growth wasn't just about quantity, but quality too. For much of July, the data revealed a more stable deployment pattern, with AI Overviews fluctuating less than in June. What's particularly intriguing is the evolution within July itself. The month kicked off modestly, but we observed a significant shift starting July 18th. This marked the beginning of a week-long surge, peaking on July 21st when AI Overviews appeared in 12.05% of search results. This sustained period of elevated AI presence suggested a deliberate expansion by Google, possibly testing user reception or rolling out improvements to a broader set of queries.
However, the end of July brought an unexpected twist. On July 30th and 31st, we saw a sharp decline in AI Overview presence, dropping to under 8% of search results. This drop also coincided with the announcement of OpenAI’s foray into search with SearchGPT which may suggest Google is exercising more caution with how AI Overviews are deployed.
This sudden drop raises interesting questions about Google's strategy. It could indicate a recalibration of the AI Overview algorithm, perhaps in response to user feedback or performance metrics. Alternatively, it might suggest a more cautious approach as Google evaluates the impact of the mid-July surge.
Despite this late downturn, it's important to note that AI Overviews still maintain a stronger presence compared to June levels. This volatility underscores the experimental nature of AI integration in search results. Google appears to be actively adjusting its approach, balancing the value of AI Overviews with other considerations such as relevance, user experience, and computational resources.
As we continue to track this trend, it's clear that Google's implementation of AI Overviews is still in a state of flux. The company seems to be fine-tuning its strategy, potentially seeking the optimal balance between AI-enhanced results and traditional search offerings. This recent fluctuation serves as a reminder of the dynamic nature of search technology and the ongoing process of refining AI integration in search results.
- AIO’s deployment fluctuated by industry with different degrees of volatility
While June witnessed declines in AI Overview presence for several industries, July painted a more complex picture. We observed substantial increases, fluctuations, and even last-minute declines across various sectors, with Google refining its approach to AI Overviews based on user engagement and information needs.
To understand these changes better, we analyzed not just the growth but also the volatility of AI Overview presence. We used the Coefficient of Variation (CV), a standardized measure of dispersion that allows us to compare the relative variability across the industries. A lower CV indicates more consistency in AI Overview presence throughout the month, while a higher CV suggests more fluctuation. As mentioned above, BrightEdge Generative Parser detected a CV of 14.22% in July for all the keywords tracked.
Let's dive into each industry:
Healthcare: Dominant but Showing Late DeclineHealthcare maintained a high AIO presence around 65-68% for most of July, but saw a significant drop in the last few days. Volatility: CV ≈ 5.7% for most of July, increasing substantially at month's end
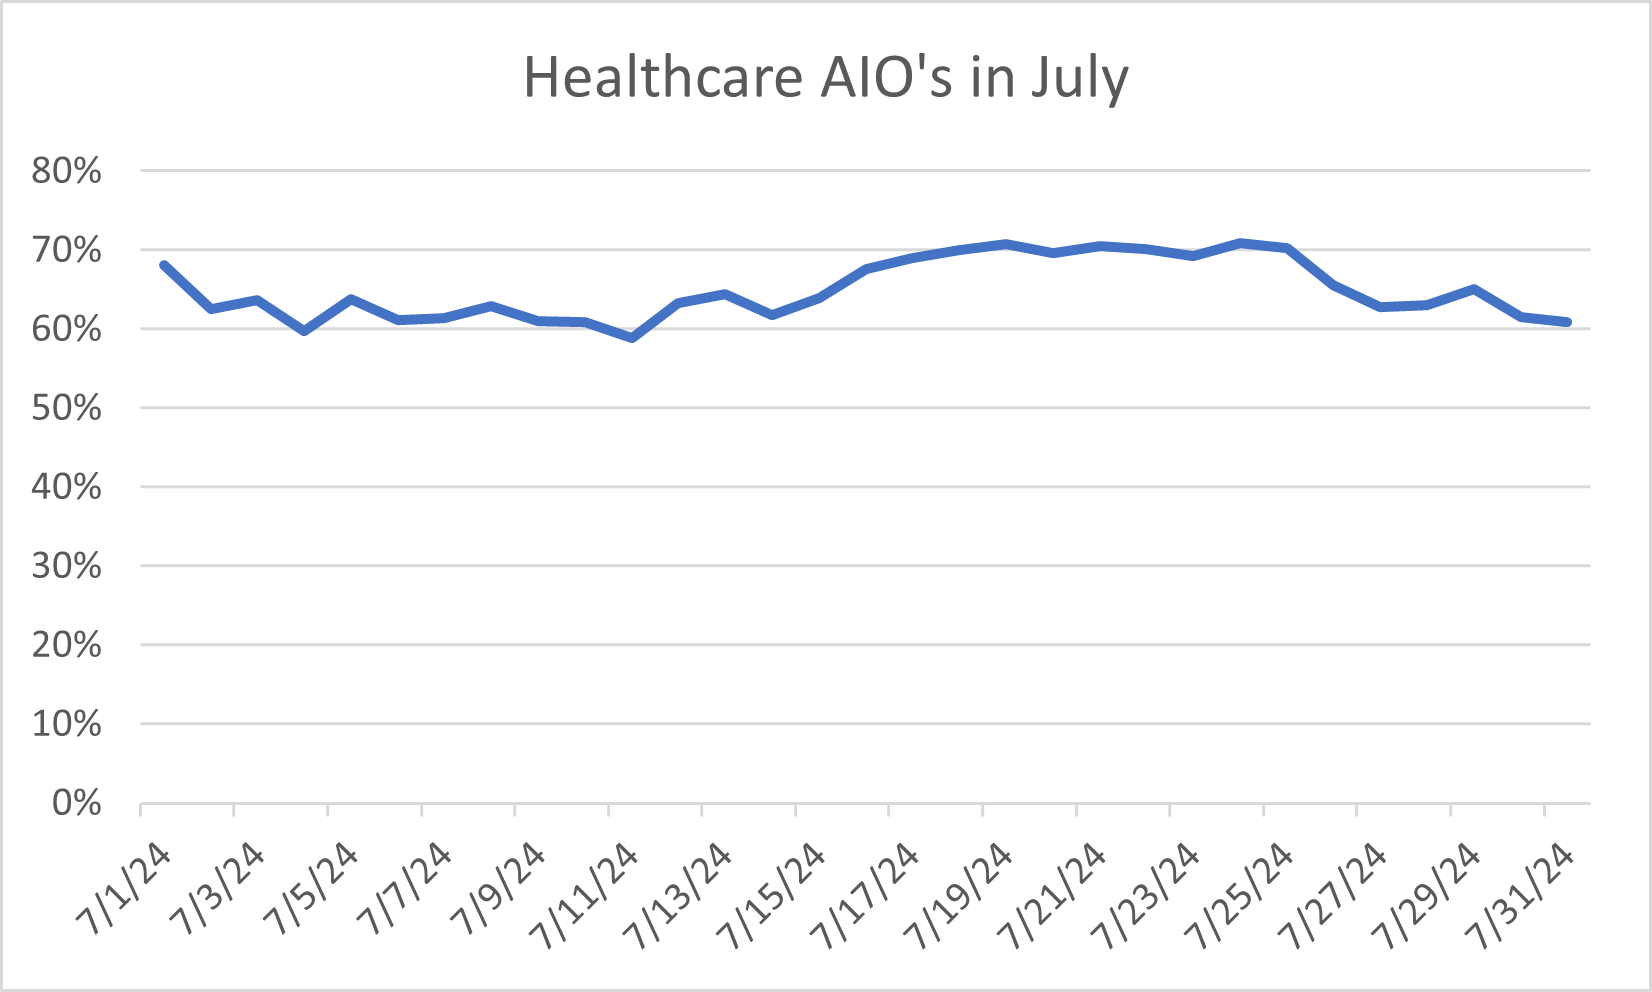
Healthcare continued to dominate in terms of AI Overview presence and showed the lowest volatility for most of the month. New additions included:
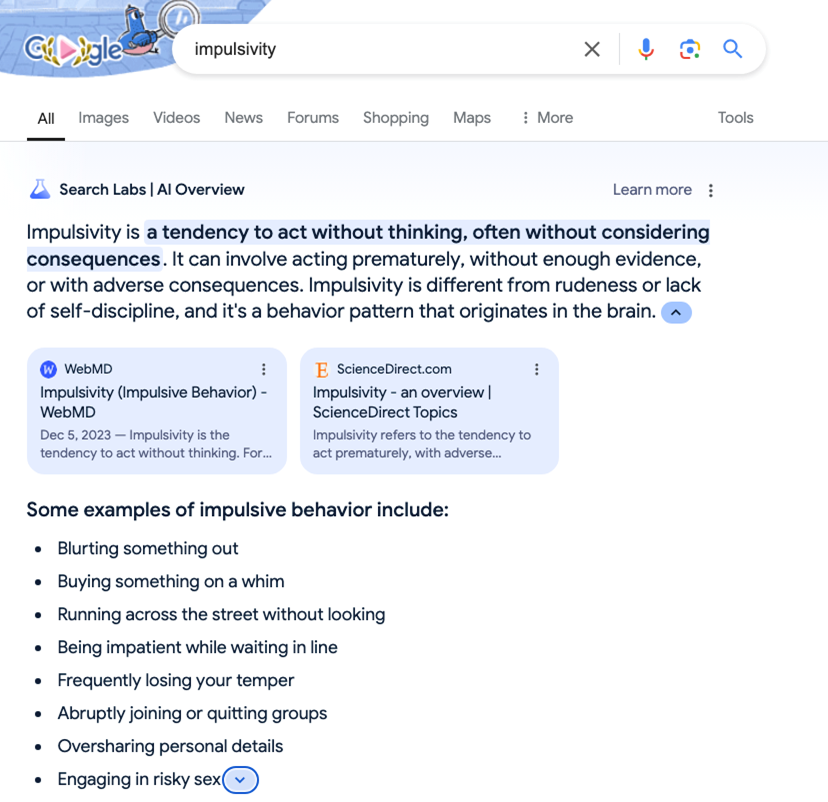
- Mental health conditions (e.g., "schizophrenia," "impulsivity")
- Medical specialties (e.g., "orthopedic," "psychiatry")
- Specific medical conditions and treatments (e.g., "osteosarcoma," "dialectical behavior therapy")
The extremely low volatility for most of July suggests Google had a well-tuned approach for health-related queries.Finance: Modest Growth with Steady Implementation
Finance saw a modest increase from 6% to 6.5% by the end of July. Volatility: CV ≈ 10.5% (Below average volatility)
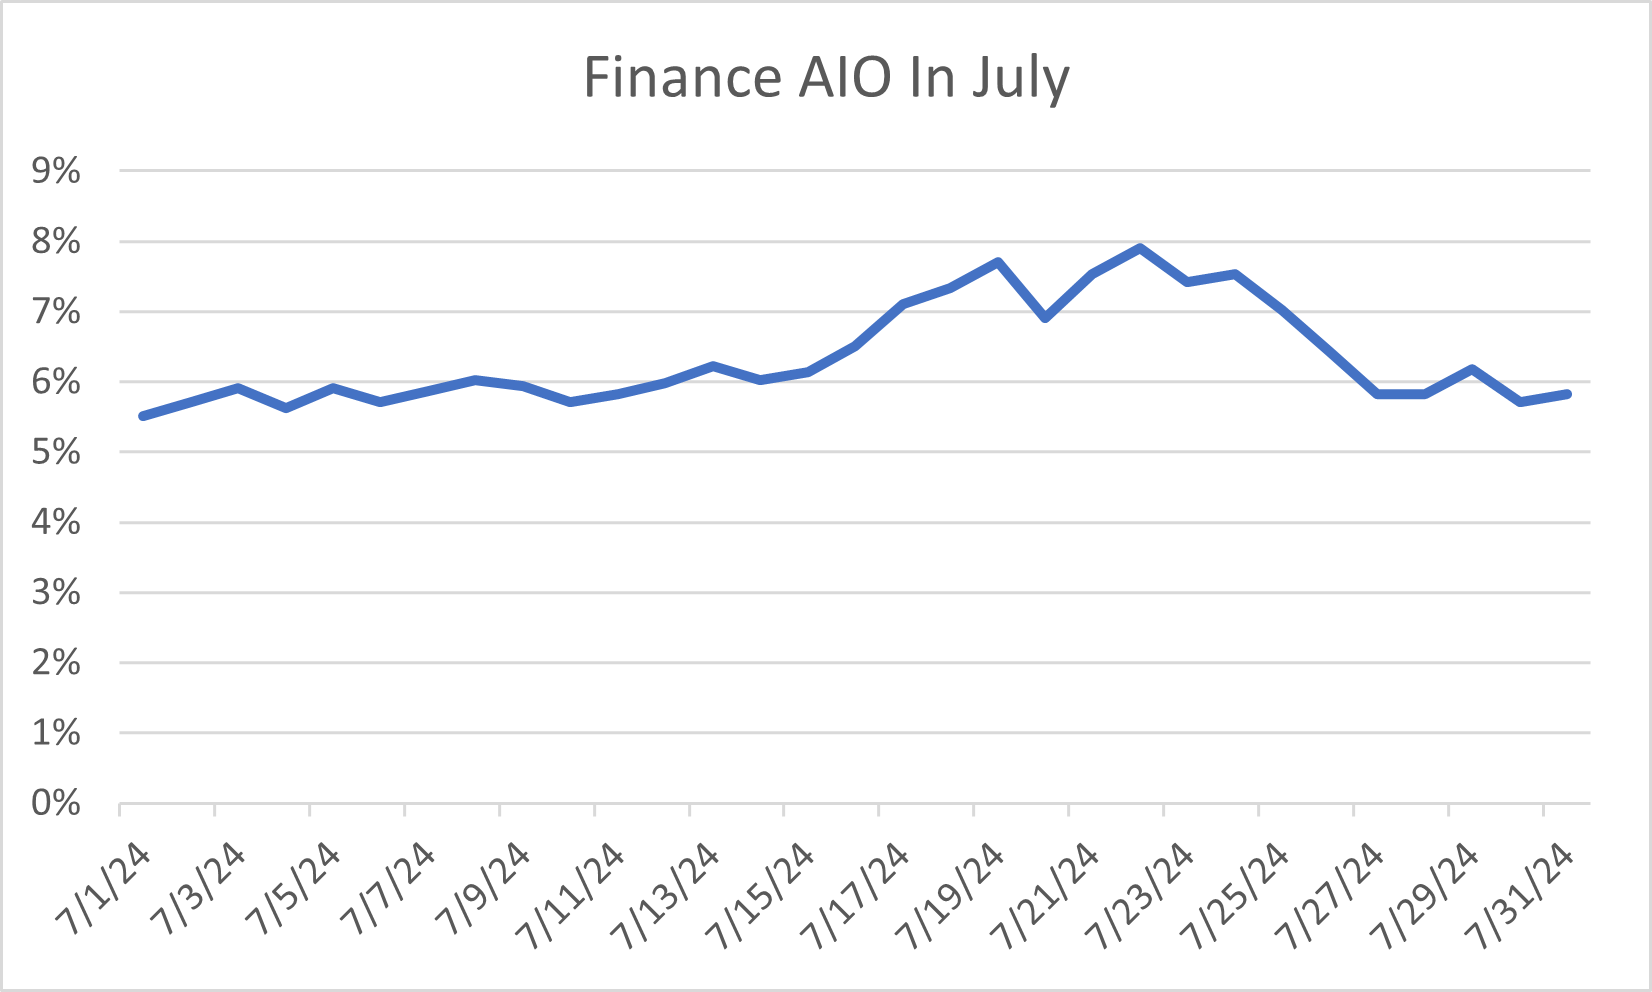
Finance showed below-average volatility, with new AI Overviews added for:- Investment vehicles (e.g., "derivatives," "reit")
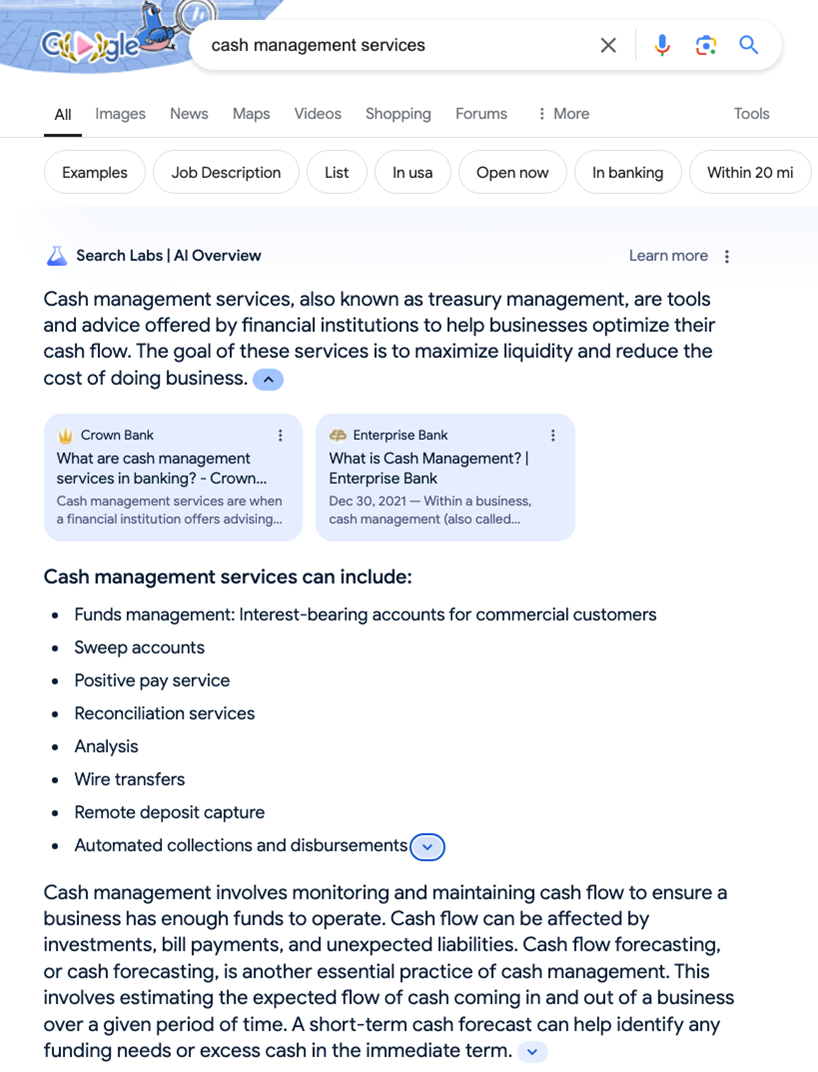
- Financial services (e.g., "cash management services")
- Estate planning (e.g., "living trust," "probate")
The low volatility indicates a cautious, steady approach to implementing AI Overviews in finance-related topics, suggesting Google has specific guidelines for when to display them in this sector.
E-Commerce: Strong Growth with Late-Month Volatility
AIO presence on E-Commerce keywords increased from 11% to 17% in July, but showed significant fluctuations at month's end. Volatility: CV ≈ 13.7% for most of July, increasing notably in the last few days
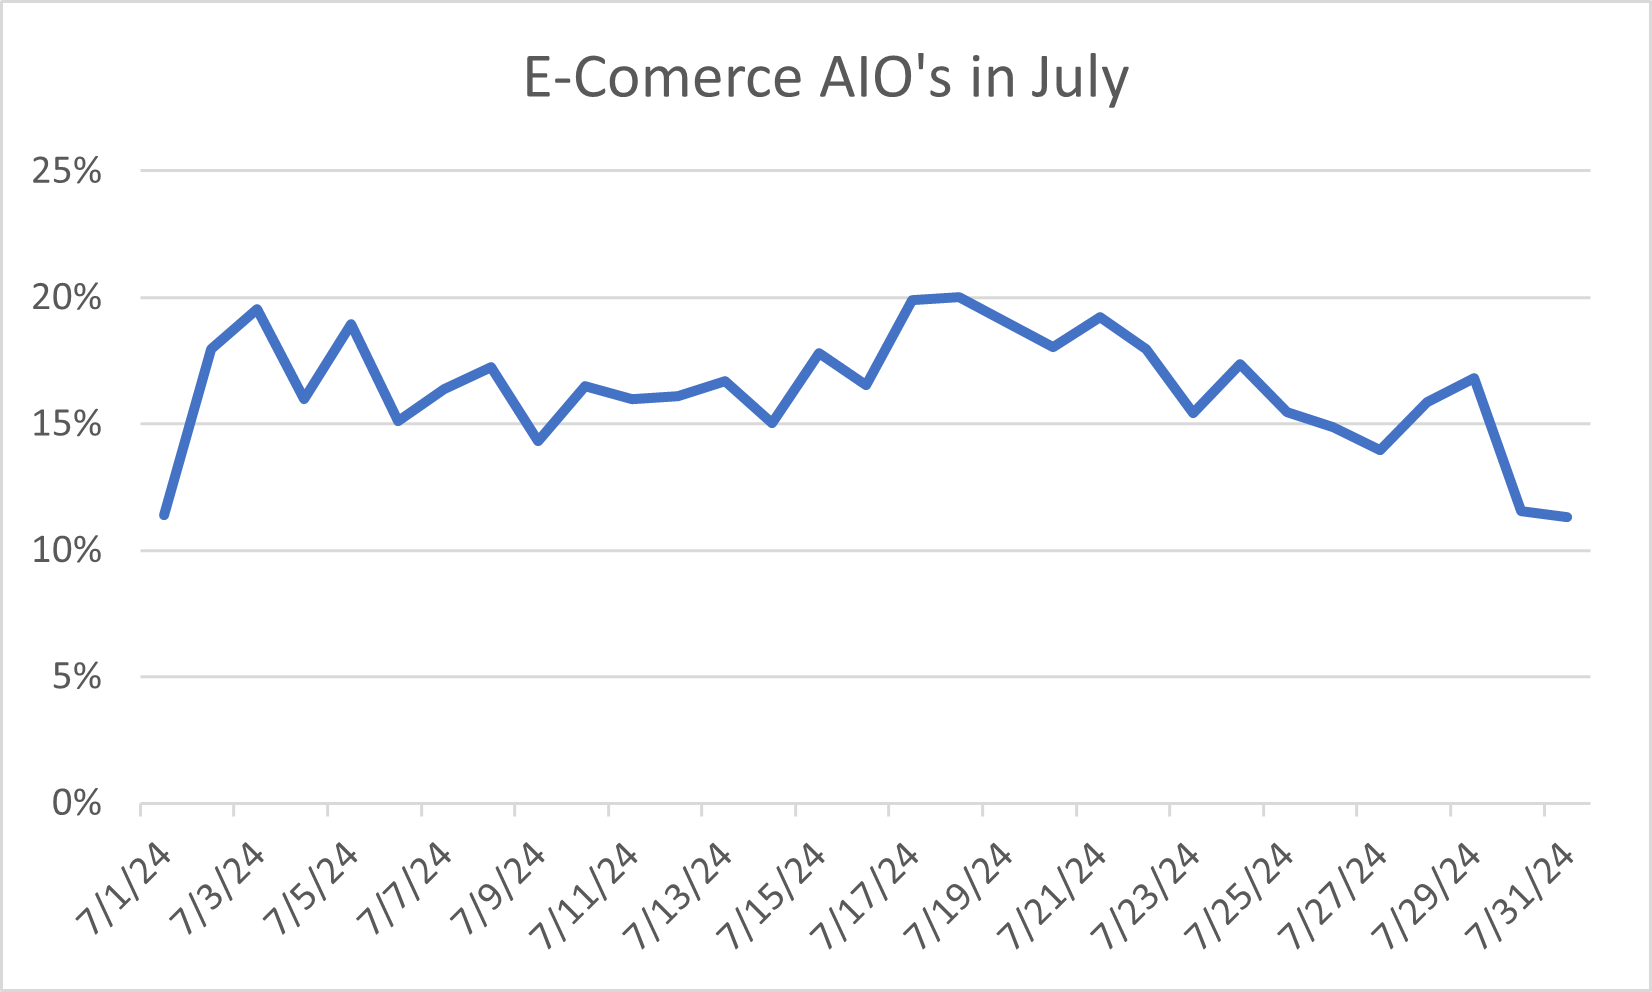
E-commerce saw significant growth for most of July with moderate volatility, covering a wide range of products:
- Electronics (e.g., "iphone 11," "google pixel 7")
- Home appliances (e.g., "washing machines," "bread makers")
- Furniture and home decor (e.g., "recliner chair," "dining table")
However, the last few days of July and early August showed increased volatility, with AI Overview presence fluctuating between 14% and 16.8% before dropping sharply to around 11% on July 31st. This late-month instability suggests Google may be fine-tuning its approach for product-related queries, potentially in response to user engagement data or as part of a broader adjustment across multiple sectors.
B2B Tech: Notable Growth with Late-Month Decline and Volatility.
B2B Tech increased from ~29% to ~45% for most of July, but saw a significant drop and increased volatility at month's end. Volatility: CV ≈ 18.9% for most of July, increasing substantially in the last few days
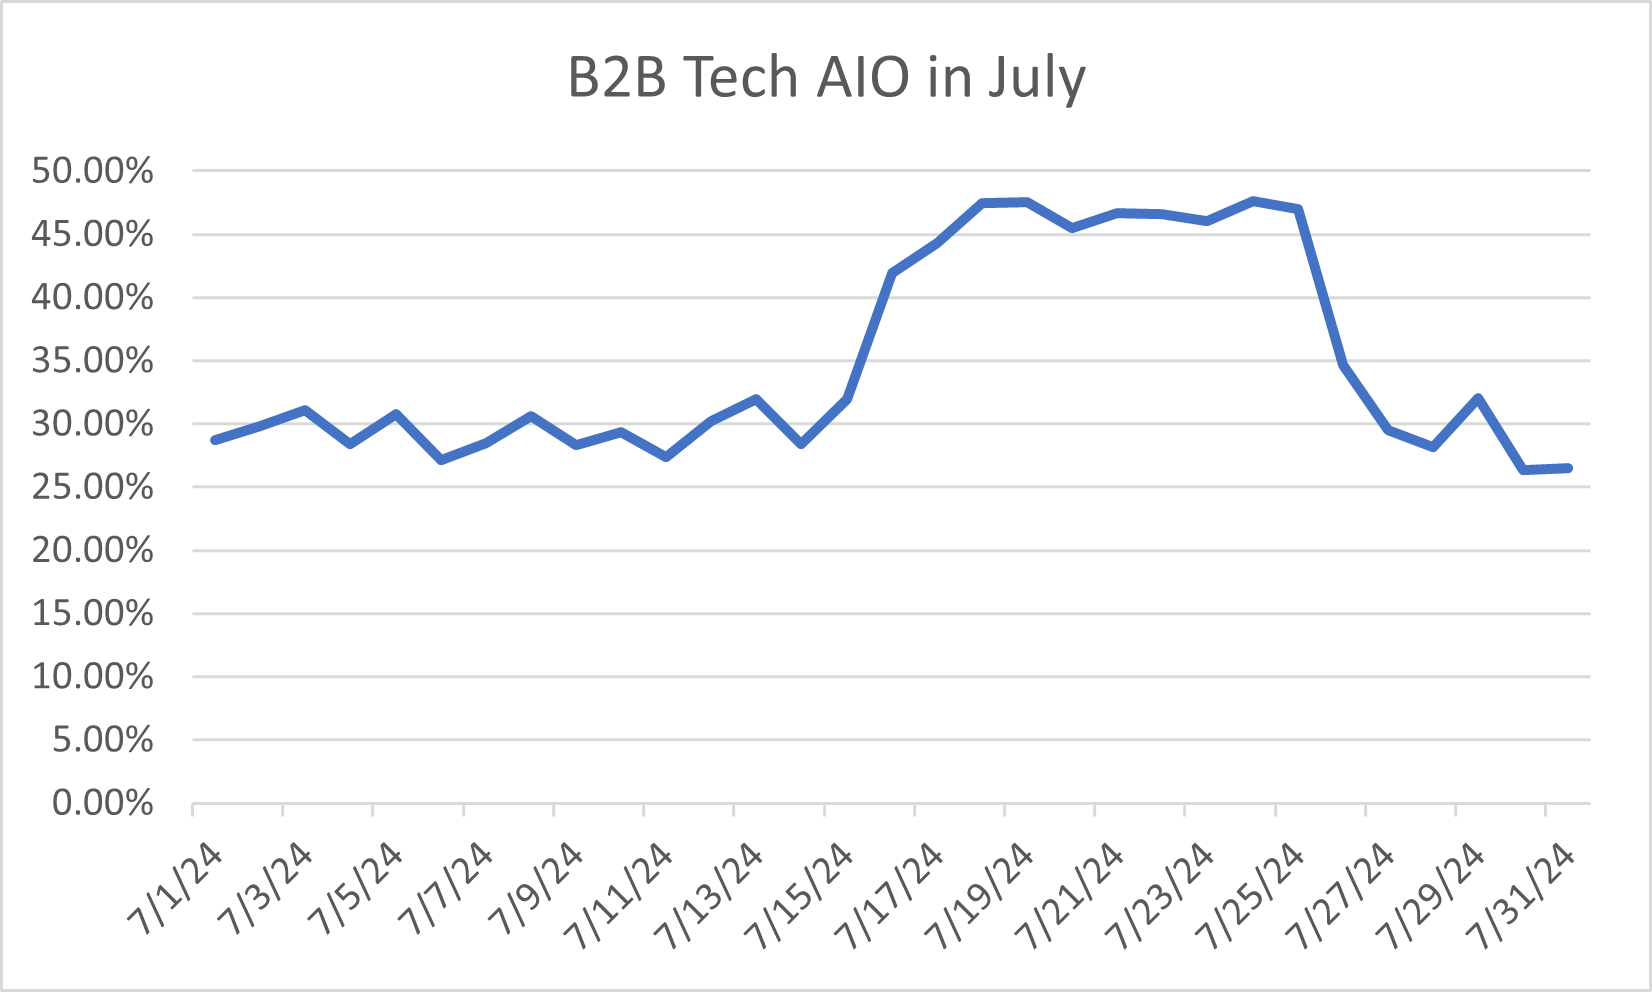
B2B Tech saw notable growth for most of July with moderate volatility, particularly for:
- Advanced technical concepts (e.g., "confirmatory factor analysis," "natural language programming")
- Cybersecurity topics (e.g., "cyber security salary," "zero trust security")
- Data analysis and management (e.g., "data clustering algorithms," "data anonymization")
The moderate volatility indicates ongoing experimentation with AI Overviews in this sector, possibly due to the rapidly evolving nature of tech-related topics.
Insurance: Significant Growth Followed by Late-Month Decline and Volatility
Insurance jumped from 15% to over 35% in the second half of July, but saw a significant drop and increased volatility at month's end. Volatility: CV ≈ 37.8% for most of July, increasing further in the last few days
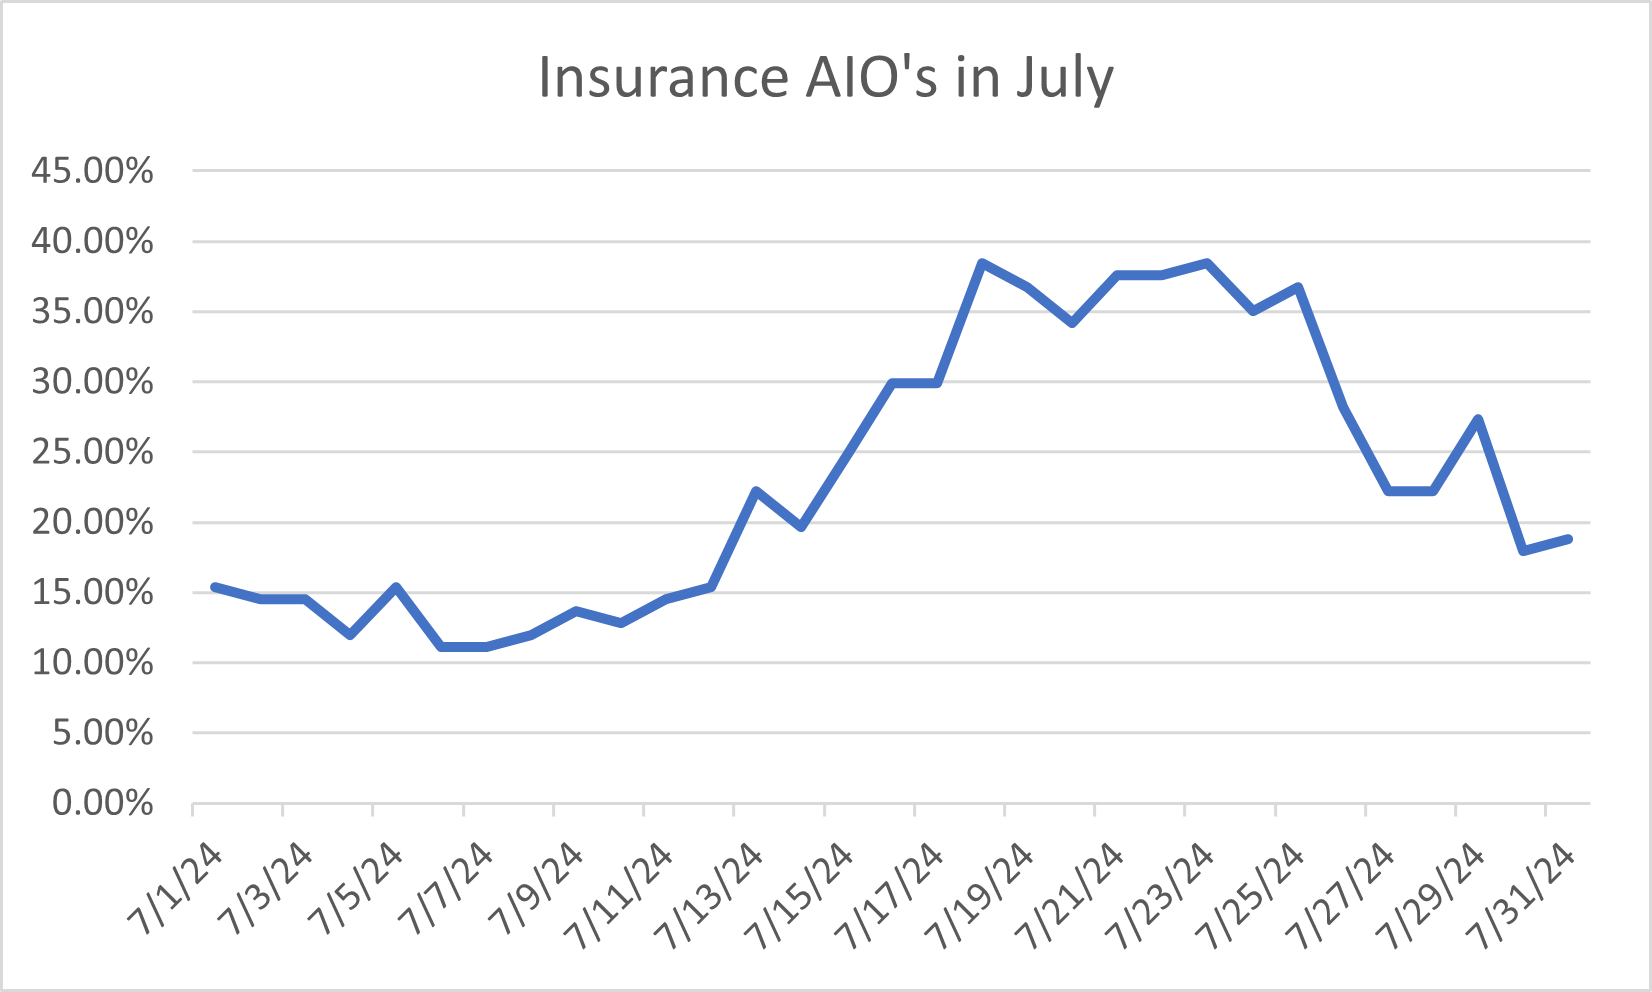
- Insurance saw high volatility throughout July, with new AI Overviews primarily related to workplace issues:
- Work culture (e.g., "organizational work culture")
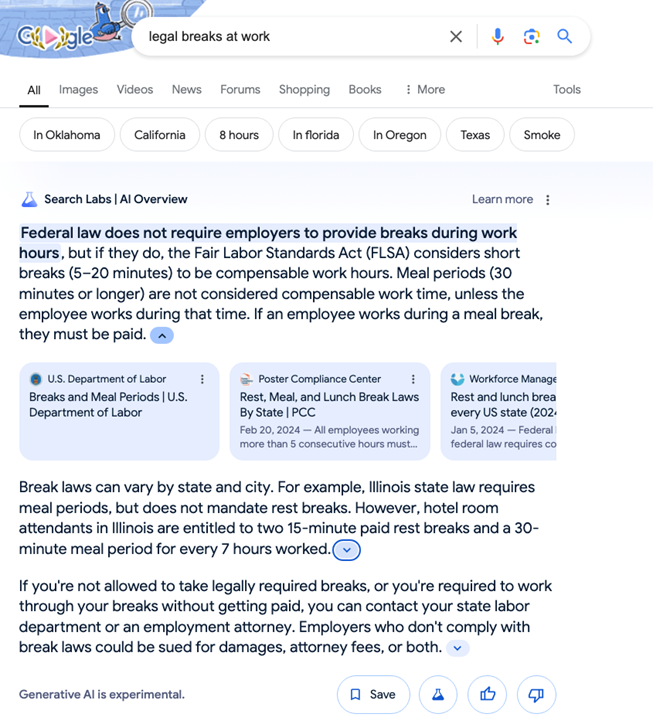
- Employee benefits (e.g., "legal breaks at work," "fringe benefits")
However, the end of July brought even more dramatic changes. AI Overview presence fluctuated significantly, dropping from a peak of 27.4% on July 28th to 20.4% by August 1st. This represents a decrease of about 25% in just a few days.
The high volatility throughout the month suggests Google was actively testing and adjusting AI Overviews for insurance-related queries. The sharp decline in the last few days could indicate a reevaluation of this approach, possibly due to challenges in providing accurate or valuable AI-generated content for insurance topics.
Education: Significant Growth Followed by Late-Month Decline and FluctuationsAIOs Presence for Education surged from 16% to 38% in the second half of July, but experienced a decline and increased volatility at month's end. Volatility: CV ≈ 43.7% for most of July, with continued high volatility in the last few days
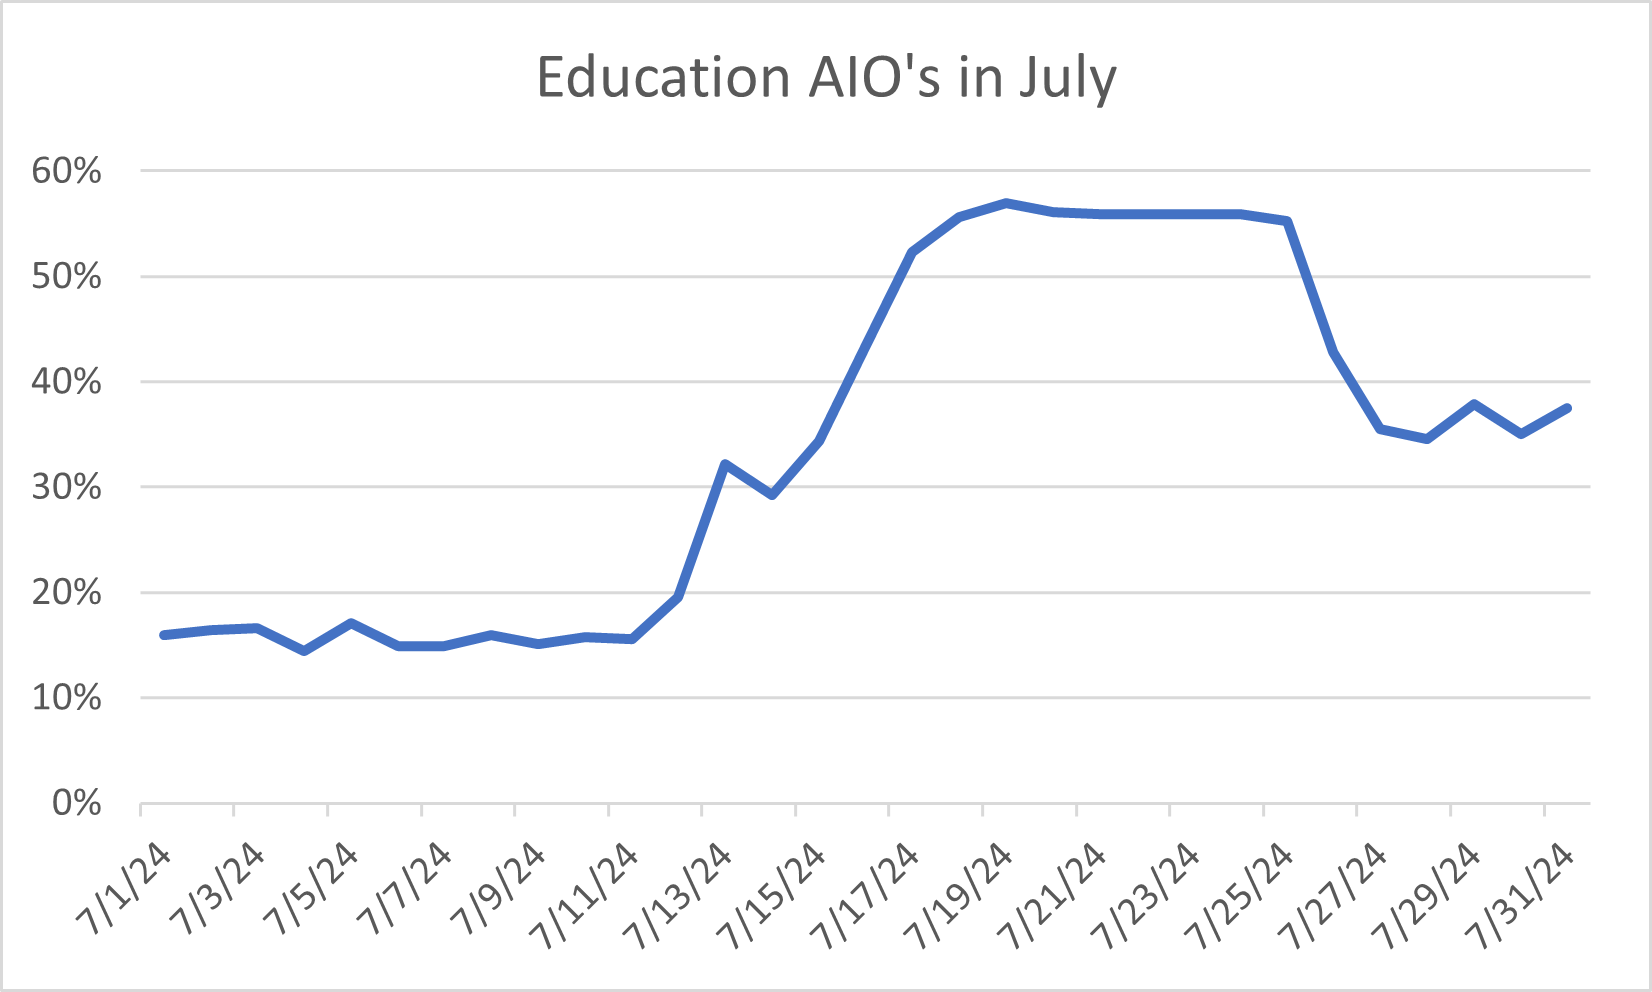
Education experienced a remarkable turnaround and very high volatility throughout July. New AI Overviews focused on:
- Degree types and requirements (e.g., "associate degree," "bachelors in science")
- Career-specific education (e.g., "cyber security salary," "nurse salary")
- Specialized fields (e.g., "mha degree," "psyd")
The high volatility suggests rapid changes in how Google applied AI Overviews to educational topics, possibly in response to user engagement or to cover a wide range of educational queries.
Travel and Entertainment: Brief experimentation followed by removal
Travel increased from near 0% to about 2%, with a brief spike to 9.4% before dropping to 0% by July 31st. Entertainment maintained a very low presence around 1% throughout July before disappearing entirely. Volatility: Travel CV ≈ 163.7%, Entertainment CV ≈ 76.8% (Extremely volatile).
These sectors showed the highest volatility among all industries, with dramatic changes at the end of July:
Travel:
July 20th-21st: Brief spike to 8.5-9.4% AI Overview presence
July 29th: Dropped to 2.7%
July 30th-31st: Further declined to 1.9%
Entertainment: Maintained very low presence (around 1%) for most of July
July 28th-31st: Fluctuated between 0.3% and 0.6%
This extreme volatility, followed by complete removal, suggests that Google was in the early stages of experimenting with AI Overviews in these industries but ultimately decided to halt their use, at least temporarily. -
AI Overviews overlapped with regular Google Results more in July
BrightEdge Generative Parser™ detected that there was more overlap in July and August with regular results and citations compared to June. Moreover, these recent months proved to be significantly more volatile, with citation sources fluctuating dramatically throughout the period.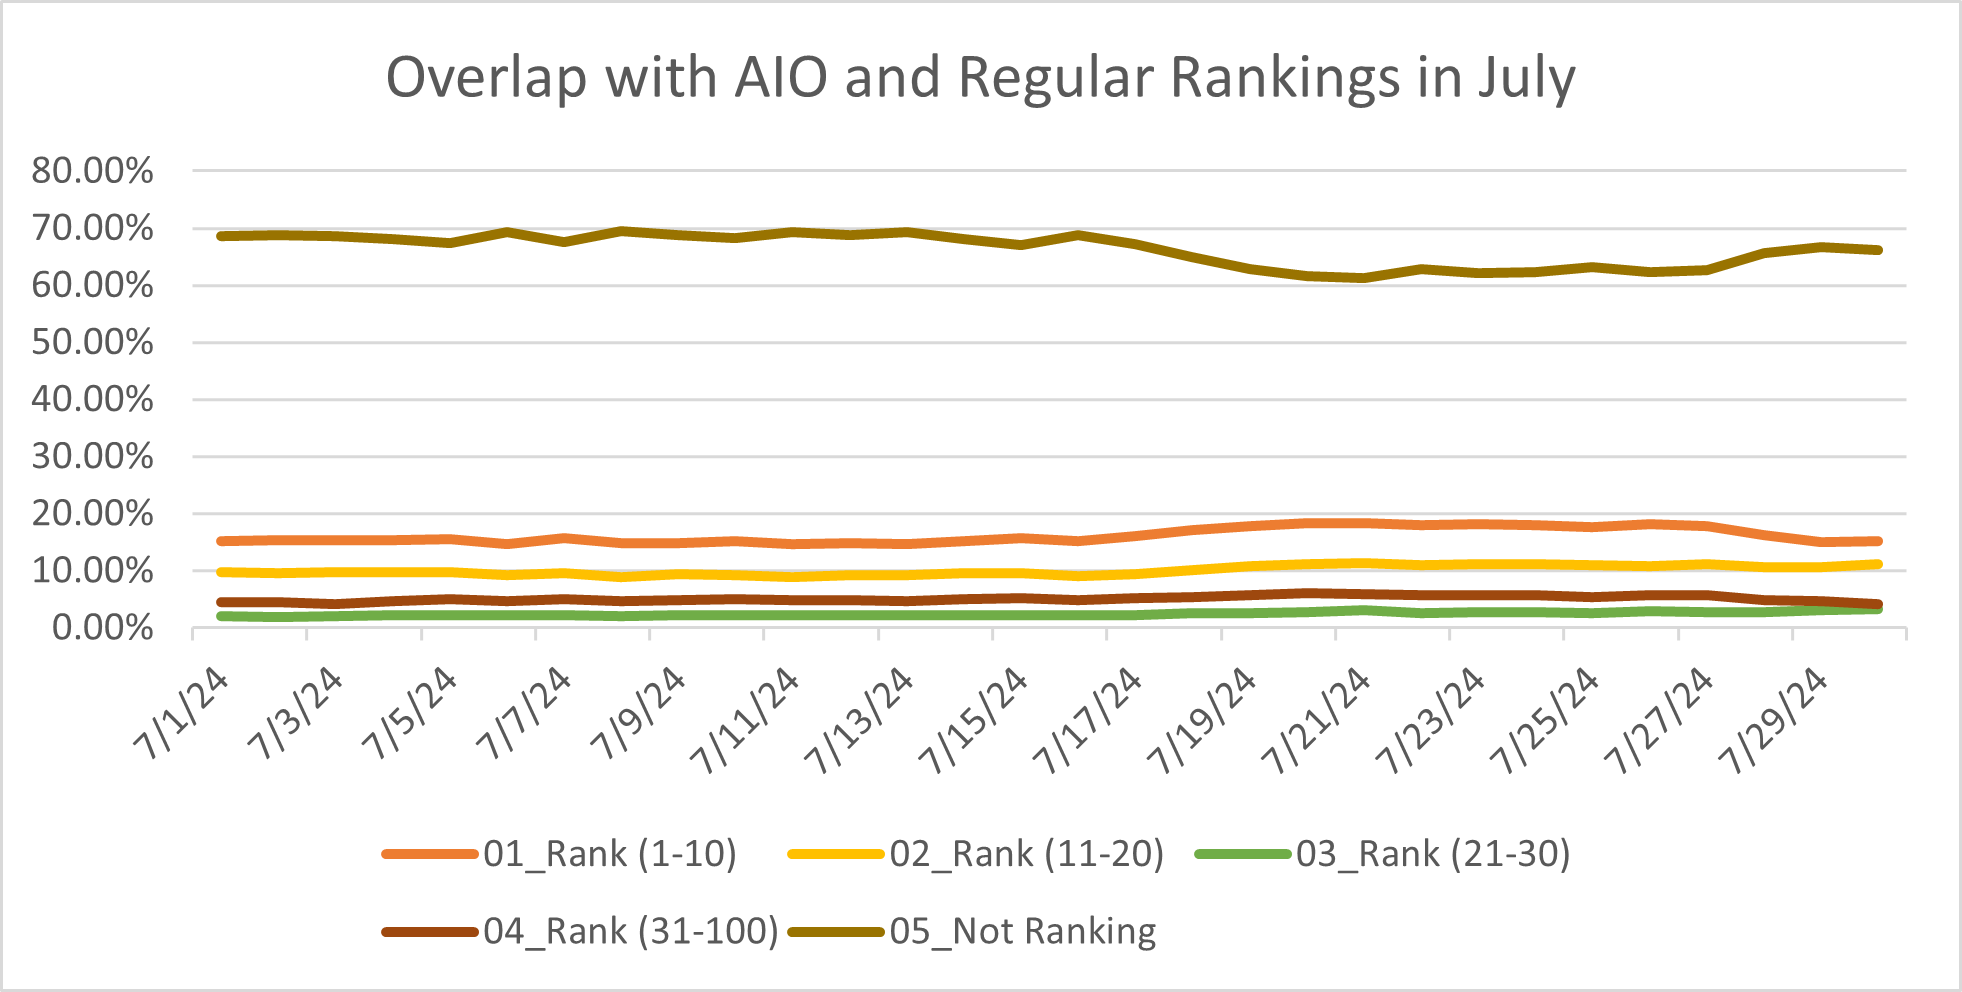
When assessing volatility, we calculated the standard deviation for each ranking cohort. July showed higher volatility across all ranking cohorts compared to June. For the top 10 rankings, the standard deviation jumped from 242.8 in June to 336.0 in July. Similar increases in volatility were observed across all other ranking cohorts.
A closer look at the data reveals some notable trends:
-While the top 10 saw slight decreases in overlap at times, it also experienced significant spikes.
-The 31-100 rankings experienced a general increase in overlap, sometimes exceeding 3%, indicating that Google is diversifying its sources for AI Overviews, pulling in more information from lower-ranking pages. -Mid-range rankings, particularly the 11-20 cohort, while generally more stable, also saw notable fluctuations corresponding with the top 10 spikes.
-The 21-30 cohort showed more variability than initially observed in July.
The increase in overlap for lower rankings highlights the growing importance of pages related to primary keywords, even if they're not in the top 10. High-quality content can still be valuable for AI Overviews, regardless of its ranking position.
For digital content marketers, these trends underscore the importance of content related to the core targeted keywords. Strategies should focus on creating comprehensive, high-quality content that addresses user needs across various topics related to your industry, as opportunities for visibility in AI-generated content are becoming more widely distributed across regular rankings. - Features in AI Overviews fluctuated throughout the month of July
BrightEdge Generative Parser™ detected fluctuations in content presentation and user experience. Features within AI Overviews show insights into how they are adapting to maximize value to the user.
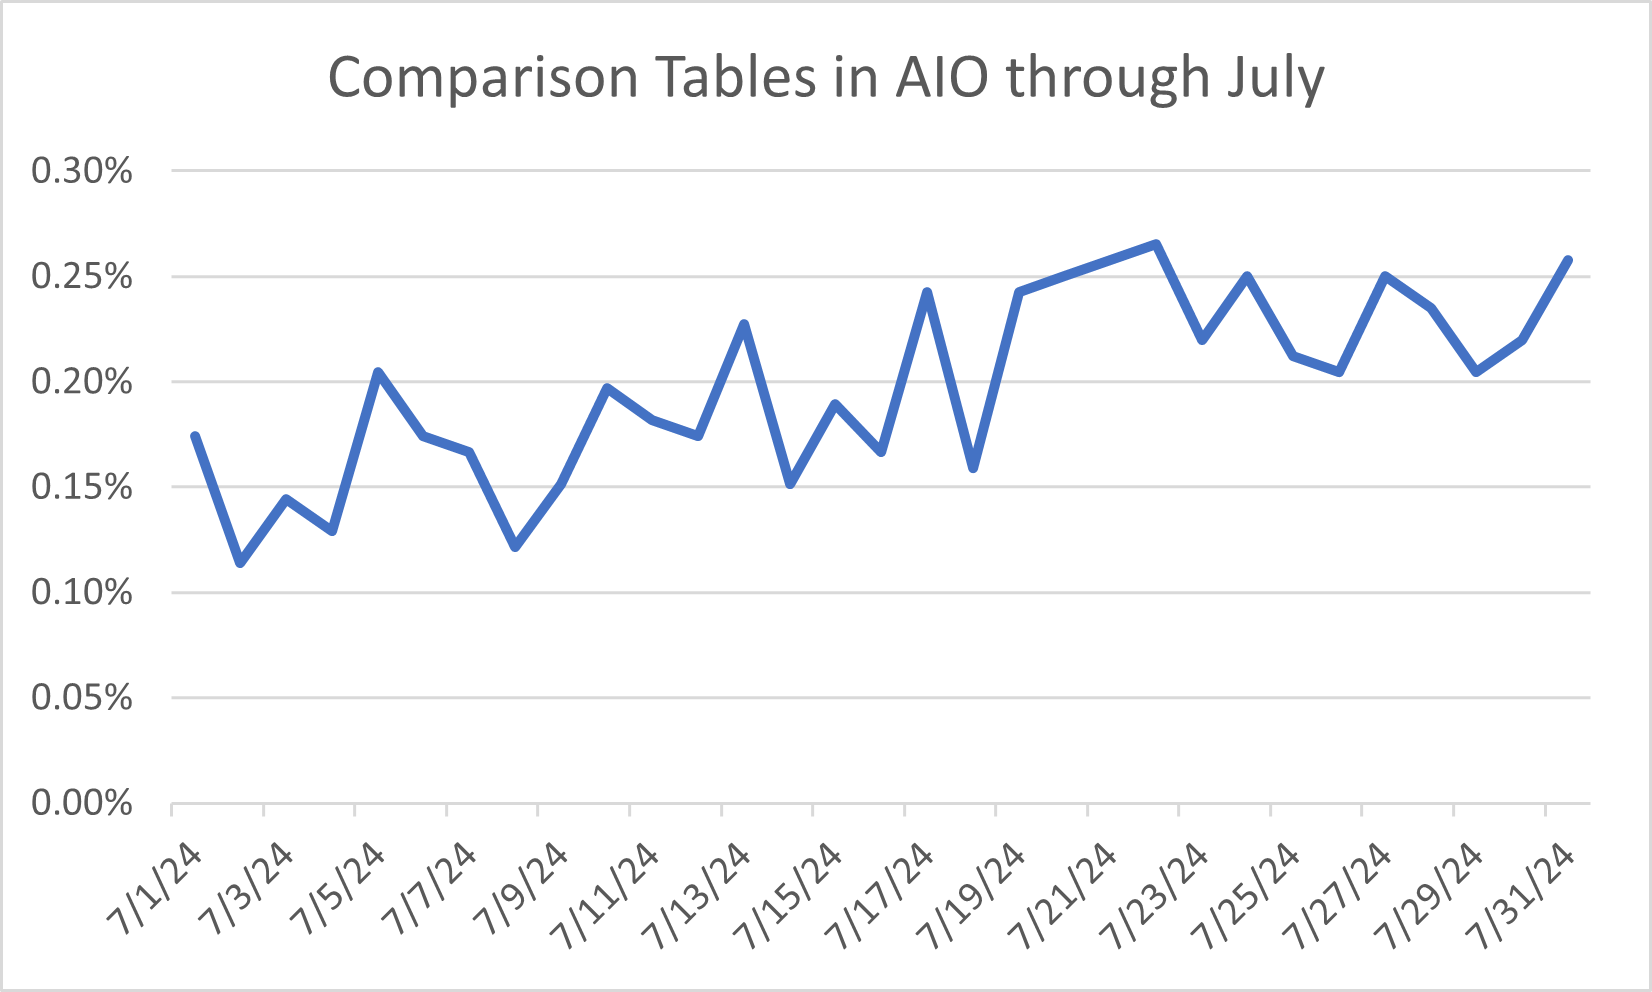
Versus Tables: These showed a 175% increase in average daily occurrences from June to July, this feature expanded its presence significantly. While still appearing in less than 1% of keywords, its growth trajectory suggests an increasing emphasis on comparative content in AI Overviews.
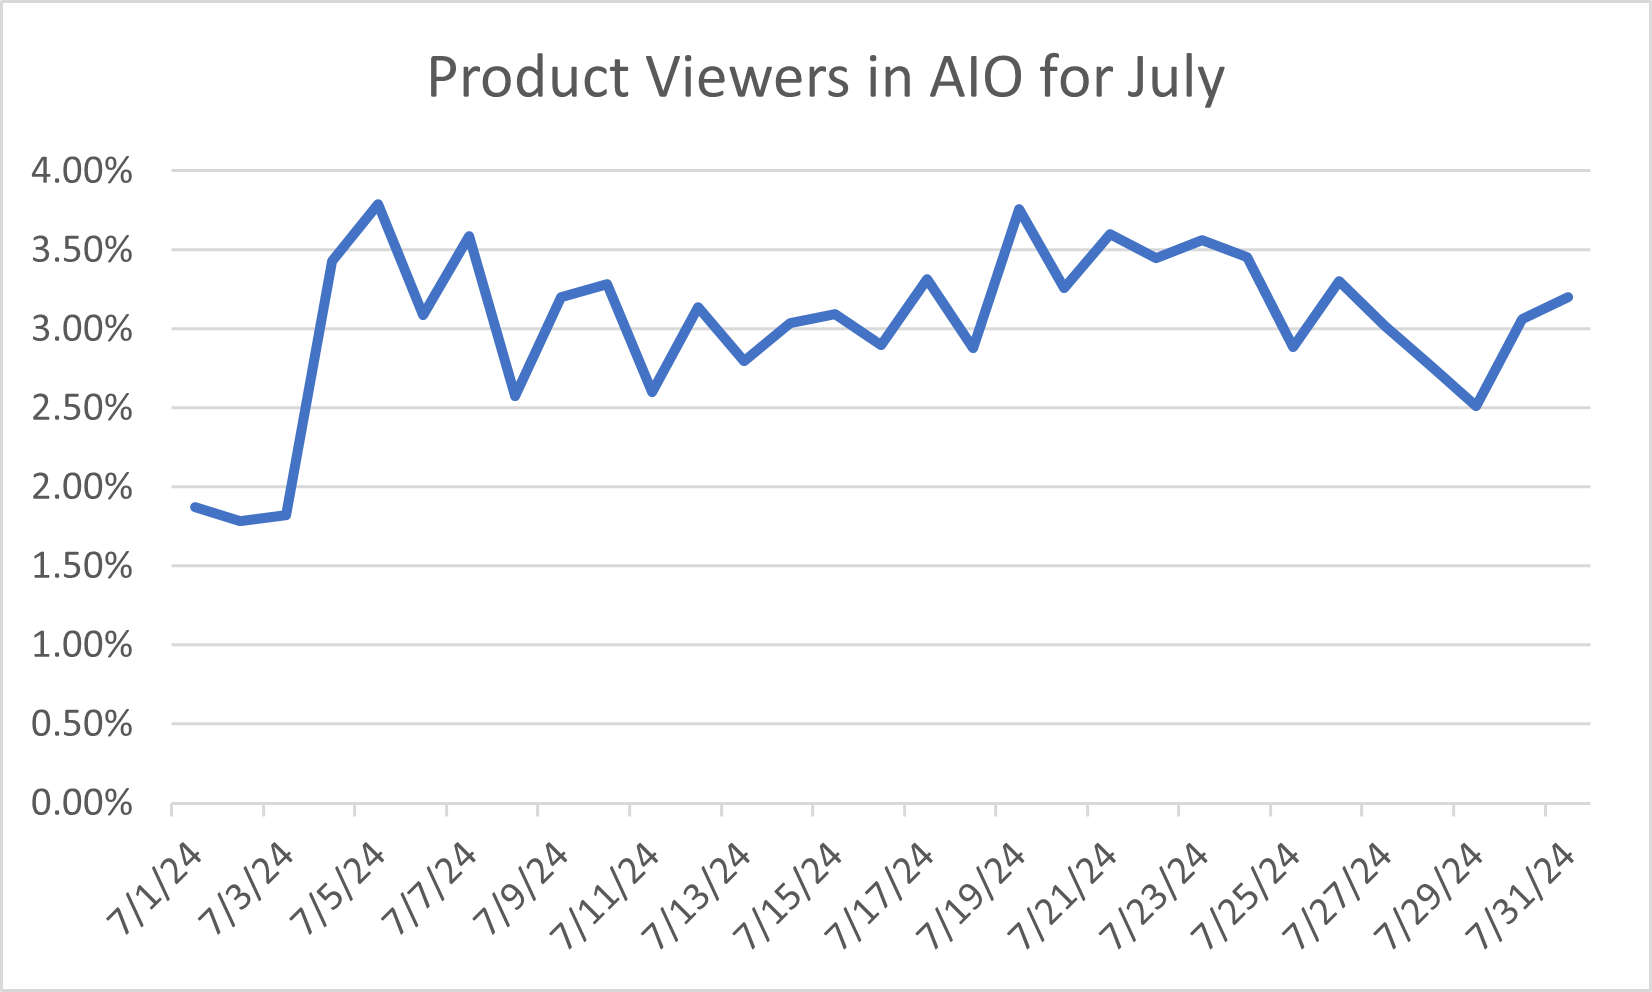
Product Viewers: The Product Viewer as a standalone (outside of a carousel or a breakout), particularly for shopping-related content, experienced a notable downturn. Previously appearing in about 13% of our keywords in June, it saw a 70% decrease by July. This shift represents one of the most substantial changes for features, suggesting elements like faceted results and unordered lists with breakouts being preferred for AI Overviews
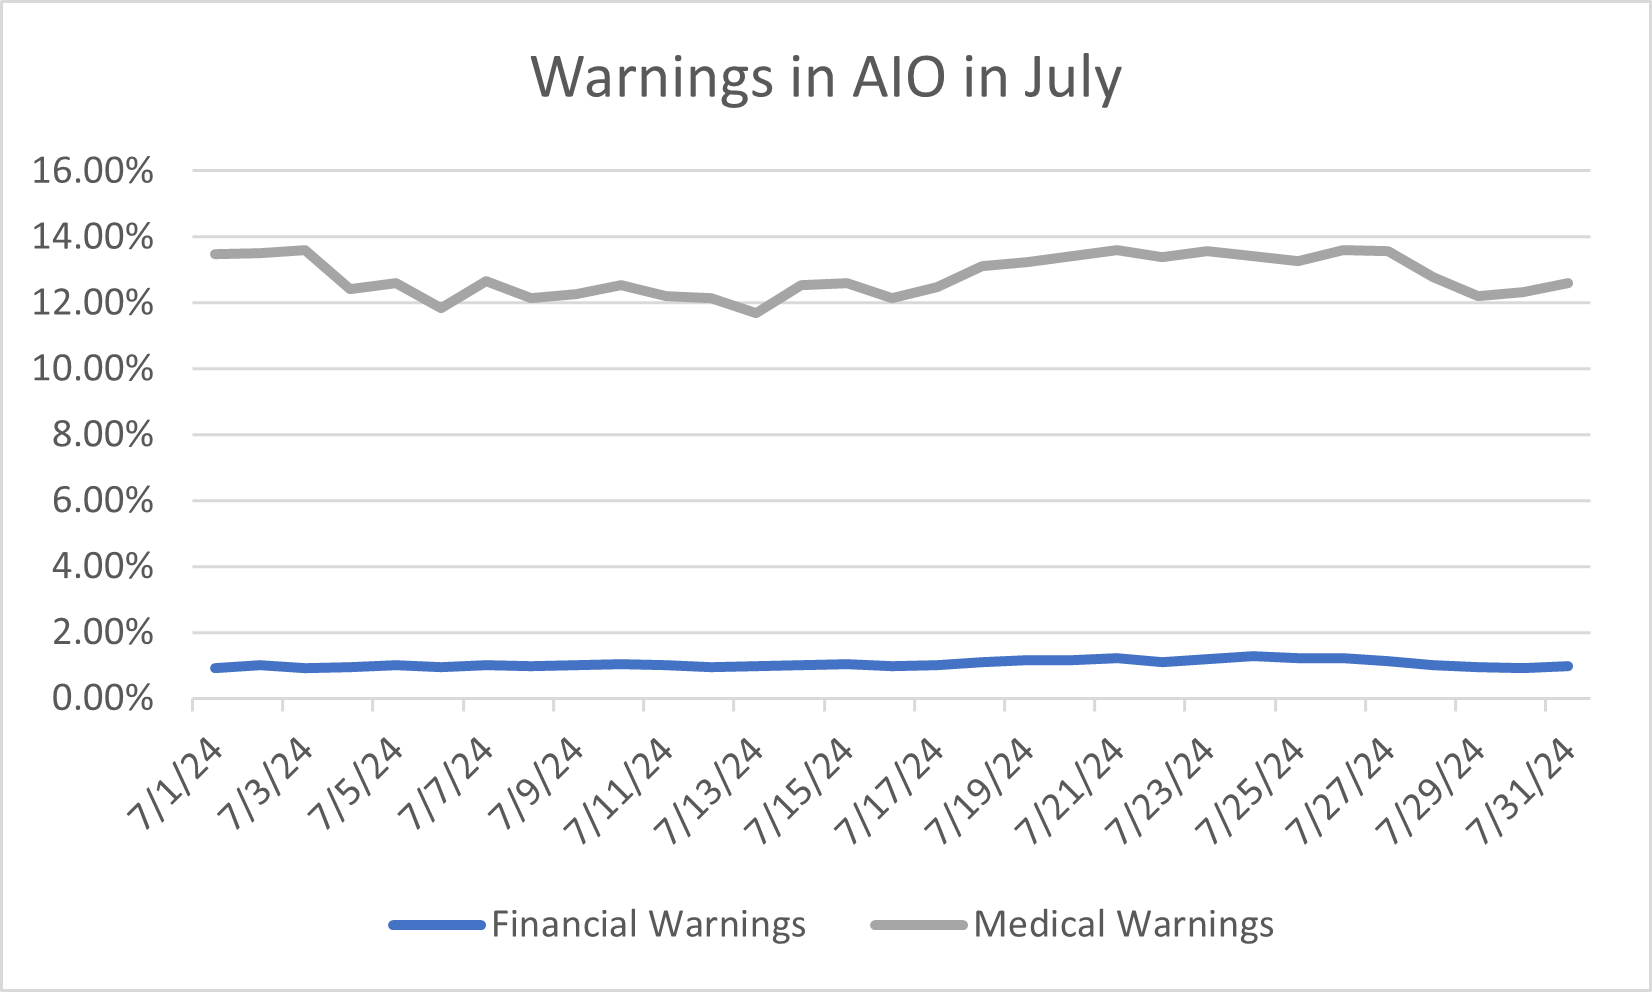
Warnings correspond to category growth: Medical Warnings, which are the most common warning type experienced a 10% increase from June to July, consistently appearing in about 13-15% of keywords. Financial Warnings, less common but still significant, decreased by approximately 40%. This suggests Google is dialing in which queries are able to deliver the most trustworthy results.
Volatility Analysis July showed increased volatility compared to June across several features:- Versus Tables: 85% more volatile in July, though this volatility is amplified by its low occurrence rate.
- Product Viewer: 40% increase in volatility, significant given its relatively high representation in the dataset.
- Reviews: Showed extreme volatility in July, with a coefficient of variation 300% higher than in June, despite its low overall presence.
Conversely, Medical Warnings showed 25% less volatility in July, suggesting more consistent application of health-related cautions across a substantial portion of our keyword set.
These trends point to a dynamic shift in AI Overview content strategy. The move towards comparative content, coupled with a reduction in product-centric elements, suggests an evolving focus on diverse information presentation. The increased volatility in key features indicates ongoing experimentation, highlighting the fluid nature of AI-generated content in search results.
The substantial decrease in Reviews and Product Viewer features, alongside the growth in Versus Tables, may indicate a shift from individual product focus to broader category comparisons, albeit affecting different proportions of our keyword set. Meanwhile, the consistent and substantial presence of Medical Warnings underscores a continued emphasis on providing cautious, health-related information across a significant portion of queries.
This evolution in AI Overviews reflects a broader trend in search engines' approach to information delivery, prioritizing comparative analysis and health awareness while reducing emphasis on direct product reviews. As these features continue to evolve, we can expect further refinements in how AI-generated content is presented to users, potentially affecting an even larger proportion of search queries. - Top Cited Domains Fluctuated across categories in July
Comparing data from June to July, BrightEdge Generative Parser™ identified changes that suggest a refinement in where AI Overviews cite information the most.
Wikipedia, often considered a cornerstone of quick information retrieval, showed a slight decline of about 5% in daily search volume. This marginal decrease might indicate that AI Overviews are diversifying their sources rather than relying heavily on this encyclopedic giant.
Health-related top content sources saw some fluctuations. While some major players like mayoclinic.org and clevelandclinic.org experienced declines of 12% and 7% respectively, others like hopkinsmedicine.org saw a significant boost of 30%. This trend suggests a pivot towards more specialized medical institutions over general health information hubs.
Interestingly, government health resources weren't immune to this shift. The CDC's website, for instance, witnessed a 15% decrease in citations. This could reflect a broader trend of AI systems favoring a more diverse range of expert sources over centralized authorities.
The most dramatic change was observed in news and media outlets. USA Today, for example, saw a 60% drop in citations, while Forbes experienced a 30% decline. This substantial decrease might indicate that AI Overviews are prioritizing more specialized or academic sources for current information, rather than relying on general news outlets.
On the flip side, BrightEdge Generative Parser™ detected an uptick in citations for technology-focused websites, with tomsguide.com enjoying a 40% increase. As we see increases in AI Overviews for broader terms and more sophisticated technologies, these sources are likely preferred over general news sites or sites such as Wikipedia.
Academic sources also gained ground, with yale.edu seeing a 25% boost in citations. This trend towards more scholarly sources aligns with the overall shift towards specialized, expert content that we're observing.
These changes paint a picture of AI Overviews evolving to provide more nuanced, specialized information. The systems appear to be moving away from broad, general sources and gravitating towards expert, academic, and niche content providers. This could result in more in-depth, specialized responses to user queries.
However, it's crucial to remember that these trends can be influenced by various factors, including seasonal variations in search patterns, changes in user behavior, and ongoing refinements to AI algorithms. As we continue to track these developments, we'll gain a clearer picture of how AI systems are shaping the information landscape and what it means for content creators, SEO strategies, and user experiences. - AI Overviews Continue to Shrink: July Sees a Further 12.5% Reduction in Size, with a Big Drop at Month's End
The trend of AI Overviews becoming more compact continues, with July marking another significant milestone in Google's ongoing refinement process. Our data from BrightEdge Generative Parser™ reveals:
AI Overviews shrunk by an additional 12.5% during July, following June's 13% reductionWhile June was characterized by volatility and notable fluctuations, July presented a different picture. The month showed a more stable trend with gradual changes for most of the period, suggesting that Google may have found a sweet spot in terms of AI Overview size. This stability was particularly evident in the first three weeks of July.
As we move further into August, we will watch to see if this new size range (about 6-7% smaller than the July average) represents a new baseline or if Google will continue to experiment with AI Overview dimensions. The continued reduction in size does suggest that Google is optimizing AI Overviews to fit alongside other elements in the search result. - AIO’s experimented with citated sources differently across industries
BrightEdge Generative Parser™ shows patterns in content volatility, with eCommerce emerging as the most dynamic sector. As AI search technologies are still earning trust with the public, with some acknowledged issues with factual statements early on, we see AIO’s are varying how much they change citations by industry. This suggests that for some industries trusted sources are dialed in while others are still being tested. Looking at the domains that are cited by AIO across industries, we see that some are more consistent than others:eCommerce: eCommerce demonstrated the highest citation volatility among all industries tracked. From mid-June onwards, eCommerce experienced dramatic fluctuations, with some days showing increases of up to 135% compared to early June figures. This extreme variability suggests that AI systems may be rapidly reevaluating the relevance of eCommerce content across various queries.
B2B Tech: maintained a moderate level of volatility. While generally more stable than eCommerce, it wasn't immune to significant shifts, experiencing a 26% dip in mid-June before recovering. This sector's fluctuations underscore the evolving importance of technical content in AI-generated responses.
Healthcare: Despite its large keyword representation, Healthcare showed surprising volatility. A notable dip of about 20% in mid-June, followed by a rebound and stabilization, indicates that even well-established content areas are subject to AI reassessment.
Finance remained the most stable, with day-to-day variations rarely exceeding 10%.
Education showed moderate fluctuations, with a maximum variance of about 31% between its highest and lowest days.
Insurance fluctuated where it cited domains significantly with some days seeing up to an 85% increase from its lowest points.
July was an amazing month of innovation and focus for AI Overviews! As we start to look to planning for the fourth quarter and the holiday season, we will continue to monitor these trends to ensure marketers are prepared for the expanded role of AI in search! We’re excited to see where these innovations take our eco-system!